Vintage 2020
Vintage 2020
Vintage Report · The Climate and the Harvest
Rating
Harvest period
Intermediate
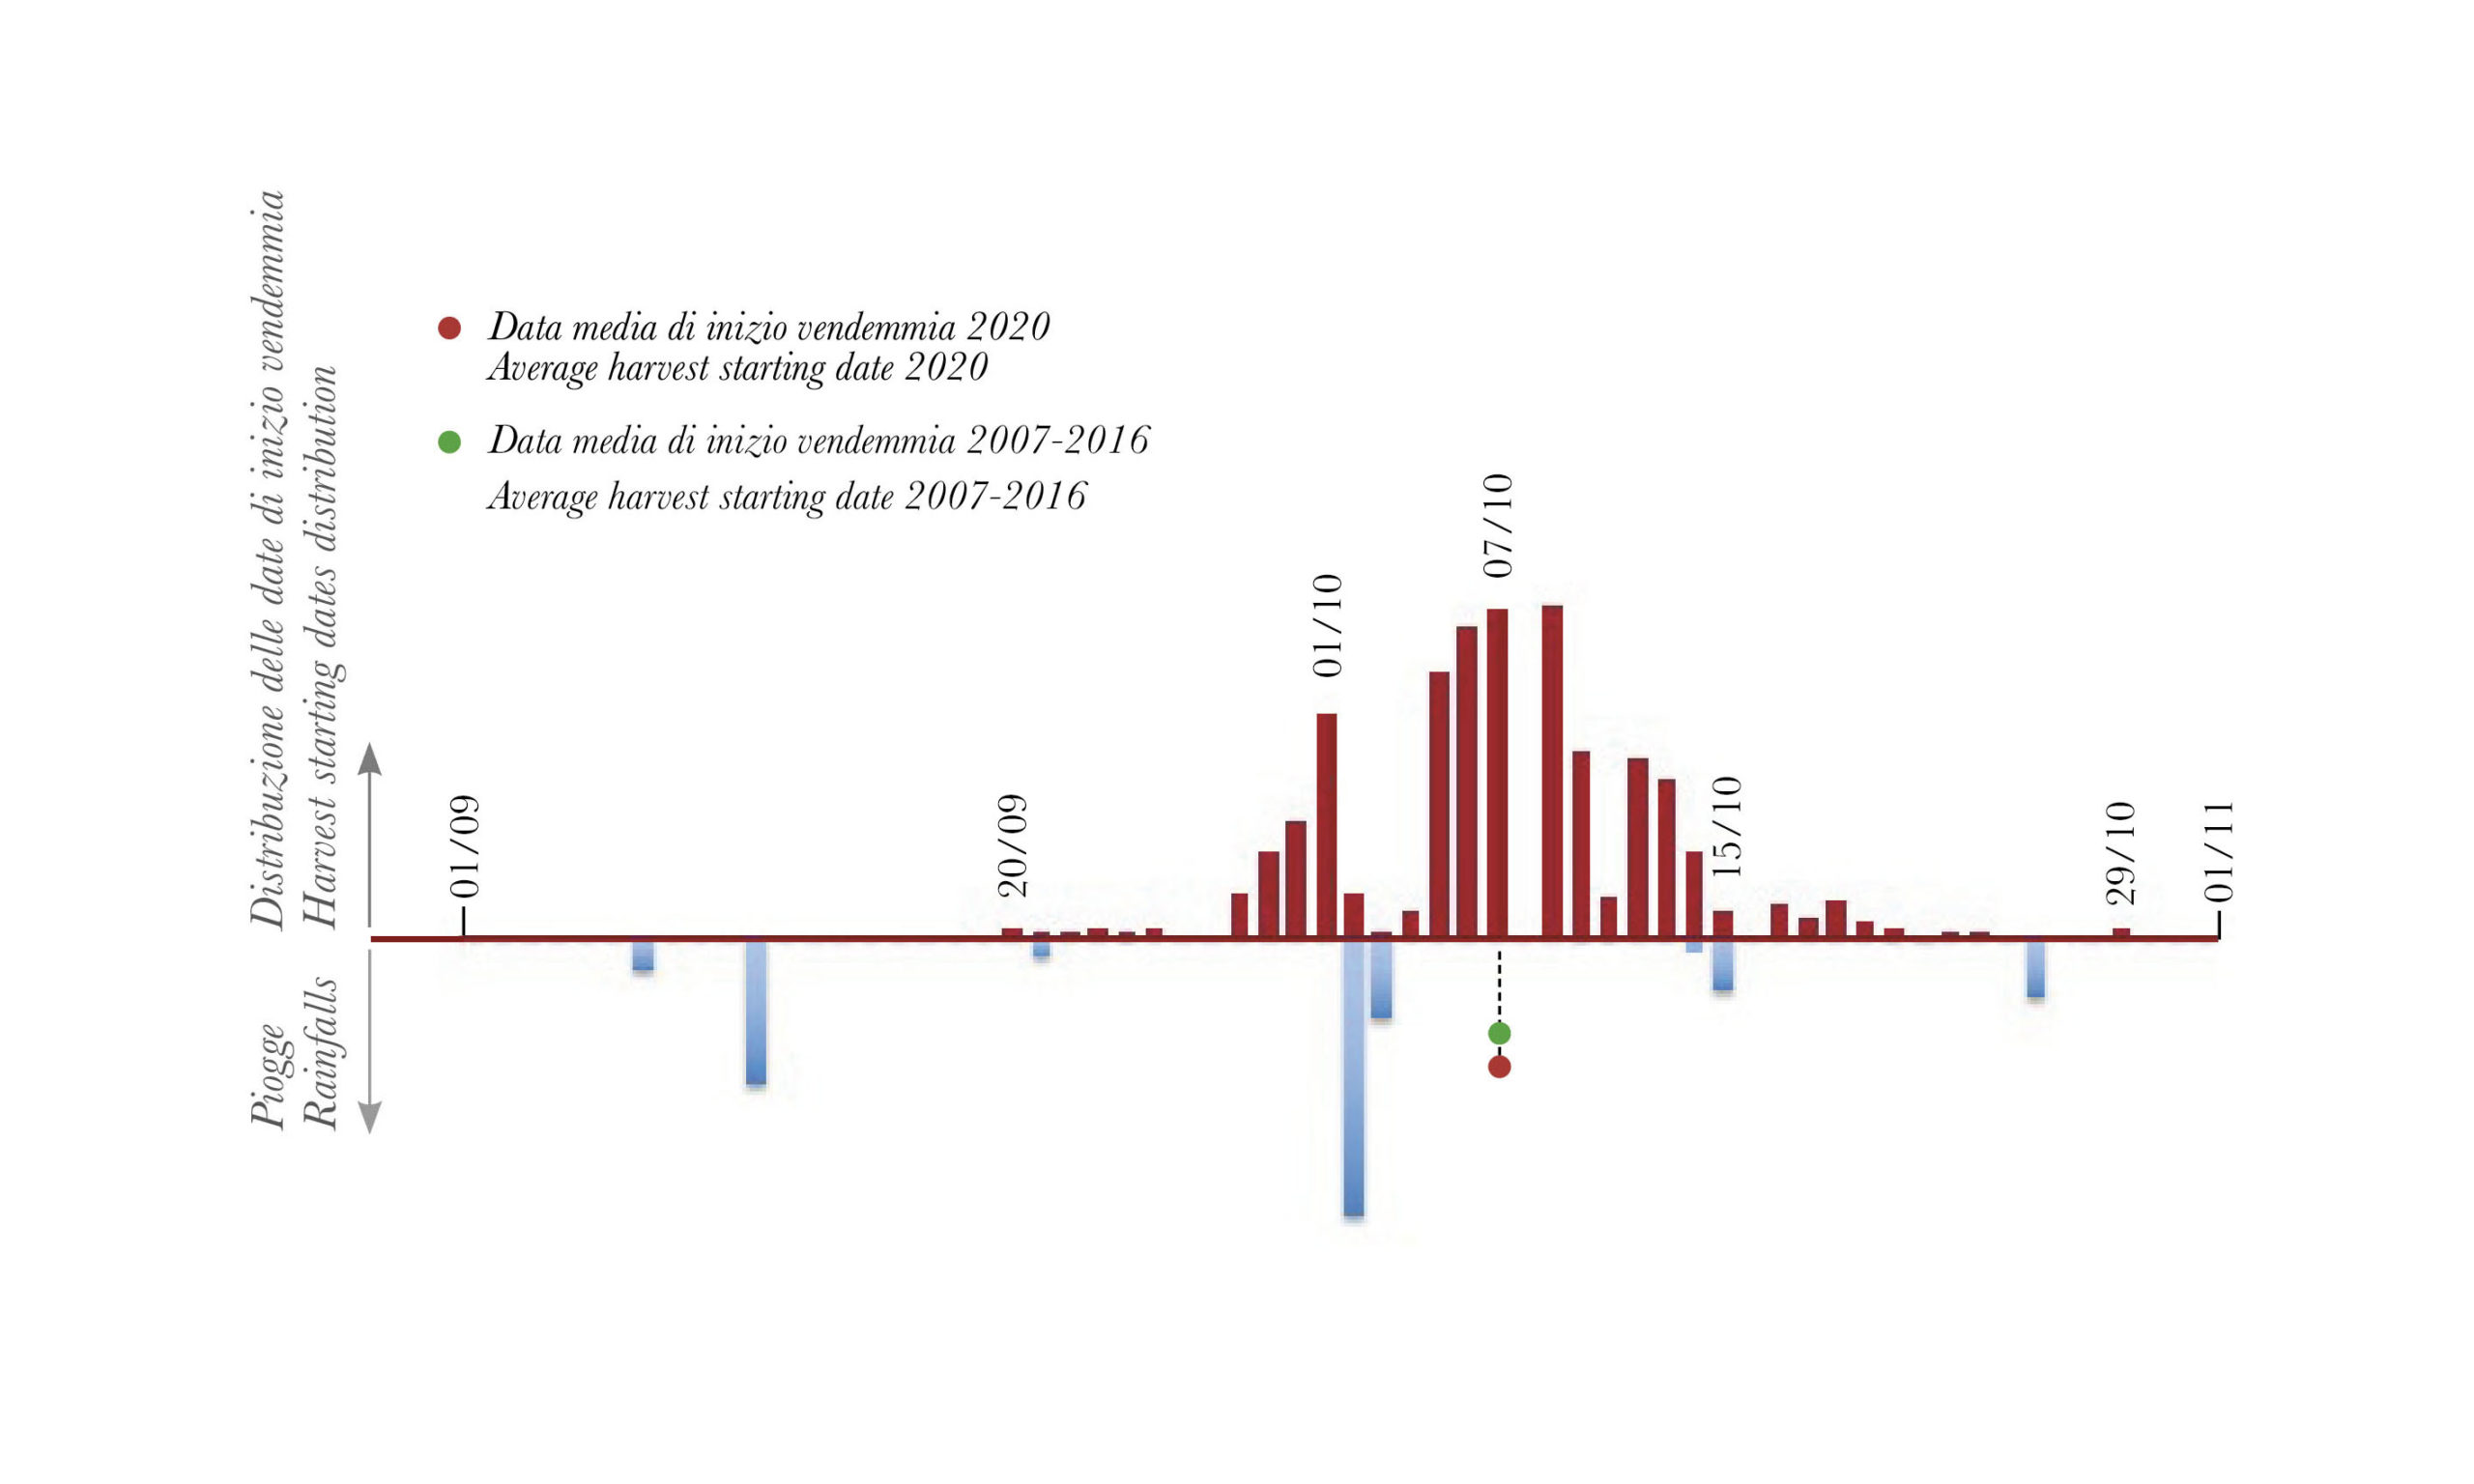
Average harvest starting date
10/07/2020 (Oct. 7)
Days of rain (Jan.- Oct.)
56 (62)
Total rainfall (Jan.- Oct.)
23.60 in (26.85)
Heat summation T>50°F (Jan.- Oct.)
3961.3 (3759.8)
However favorable the 2020 vintage may turn out to be—and as we proceed we’ll endeavor to assess that—it seems likely that twenty years from now the vintage will be remembered not so much for the quality of its wines but rather for the Covid-19 epidemic. Perhaps romantic types, like me, will remember the remarkably clear skies and clean rivers that encouraged us during the lockdown period between March and June. But technical types, if confronted with climatic and viticultural data from the period, would be hard pressed to find one or two features or phenomena that could clearly and unequivocally identify the 2020 vintage. To this end take a look at data on rainfall and thermal sums recorded at the bottom of this page.
Starting with rainfall and temperatures, it can be seen that they are in stark contrast with the general perception of the vintage, at least from June onwards. Even taking into account the heavy rains of October 2—which together with those of the early hours of the following day accumulated almost 90 mm total—the year 2020 cannot be recorded as rainy. And yet, apart from the first four months of the year, there was never a lack of water and indeed there were some problems with humidity, as evidenced by the widespread attacks of downy mildew that forced very scrupulous work in the vineyards.
The only possible explanation can therefore be found in the month-by-month graph of rainy days, which shows particularly significant levels in May, June and August, without taking into account the many days when there were brief rains of less than 1 mm, which are not recorded in the graph. In other words, rainfall was rarely abundant but very frequent, which kept the humidity level high.
Also in contrast with the general perception of the vintage are the data related to thermal sums, which in 2020 closely approached those of very hot years, such as 2003 and 2017, despite few records of particularly significant peaks of heat except between the end of July and early August. Speaking of thermal sums, it is interesting to note that 2020 is the sixth consecutive year in which the thermal sum in the January-October period exceeded 2000, a factor that occurred less regularly in the past. Probably another sign of climate change in progress.
Perhaps even more significant, however, are the rough data hidden behind the graph of the distribution of harvest starting dates, whose boundless nuances can only be grasped during the analytic phase. What first seems to emerge clearly is that in 2020 the harvest dates of the various crus were more spaced out than usual (in recent years, many producers have made it a practice to harvest various vineyards one after the other without a break in between). At the same time, several wineries, accustomed to harvesting a vineyard in a single phase, preferred to make two or more selections in 2020, whether due to exigencies related to the vintage or to carry out experiments.
Going into greater detail, the precocity of Vignarionda, and even more so of Brunate, seems very clear, at least compared to other crus that can boast equally numerous interpreters. For those familiar with my map of harvest times, this is not surprising in itself, since by tradition Brunate and especially Vignarionda are two of the most precocious vineyards of the appellation. What is unusual is that normally the precocity of a vineyard emerges clearly only with statistical analyses conducted over numerous vintages.
In any case, still focused on details of the 2020 vintage, the grapes of Brunate (with the exception of four wineries) were harvested before the rains of October 2, mainly in September. On the other hand, the harvest window of Vignarionda was much narrower, given that five producers out of seven picked between October 4 and 7, while the other two picked between September 30 and October 1.
Coming now to the final product, to the grapes and the wine, the peculiarities of this vintage seem to be inexhaustible. In the face of a harvest that at times was abundant and other times scarce, due in many cases to attacks of noctua moths in spring, the size of the berries was often above average, particularly in soils of Sant’Agata Fossili Marls, which could suggest a consequent dilution. In reality the gradations, and all that follows, have reached very high levels because the vines, having constant but not excessive moisture available and adequate temperatures, never stopped maturing and accumulating (a sharp drop in overnight temperatures at the end of September was significant). So it was not by chance that several wineries decided to anticipate the harvest in order to keep within reasonable gradations.
Whatever the case—and this is another peculiar factor—levels of acidity and pH have remained very favorable, as has the malic acid content, and also the color, which from the first evaluations has been more than satisfactory.
To conclude, at this point the question remains: what should we expect?
Producers consider the vintage to be very good to excellent, and some even go beyond that.
Personally, I expect a heterogeneous vintage, not so much in quality as in style, linked as we have seen to the winery’s choices, the crus (Brunate and Vignarionda, just to give an example), the yields per hectare and various combinations of all these factors.
How good will it be? Only time will tell.
Late November 2023 update. This is what I wrote three years ago at the time of publishing the first vintage report. Today, after so many tastings carried out in recent months in parallel with the 2019 Barolo tastings, I can definitely say that this will be a very good vintage. More ready and more elegant than the 2019, and perhaps less long-lived (but that is all to be proven). That said, is certainly much closer to my personal tastes.
January 2025 update. By this time, and for the next four or five years, I think my judgment can be considered final: not the greatest vintage ever, but certainly the one I have enjoyed drinking the most. And that is enough to confirm the 4-star rating.
Monthly rainfall in inches
< 2007-2016 average
> 2007-2016 average
| Vintage | January | February | March | April | May | June | July | August | September | October | Total |
|---|---|---|---|---|---|---|---|---|---|---|---|
| 2024 | 1.28 | 4.23 | 7.86 | 2.95 | 5.86 | 2.51 | 0.63 | 2.05 | 4.82 | 9.07 | 41.27 |
| 2023 | 0.44 | 0.74 | 1.17 | 0.48 | 9.23 | 4.58 | 0.23 | 4.84 | 1.14 | 1.97 | 24.82 |
| 2022 | 0.06 | 0.09 | 1.18 | 0.59 | 4.00 | 1.92 | 2.12 | 1.17 | 1.19 | 1.24 | 13.56 |
| 2021 | 5.40 | 0.81 | 0.17 | 1.98 | 0.89 | 1.48 | 2.08 | 0.08 | 1.00 | 1.19 | 15.08 |
| 2020 | 0.58 | 0.02 | 0.99 | 3.29 | 4.51 | 3.21 | 2.13 | 2.52 | 1.83 | 4.52 | 23.60 |
| 2019 | 0.62 | 0.89 | 0.04 | 6.58 | 4.53 | 0.31 | 5.41 | 0.51 | 3.73 | 3.16 | 25.77 |
| 2018 | 3.69 | 4.06 | 4.25 | 4.18 | 6.63 | 1.88 | 1.22 | 1.29 | 2.60 | 6.56 | 36.36 |
| 2017 | 0.41 | 2.72 | 2.45 | 2.28 | 1.89 | 1.26 | 1.79 | 0.04 | 1.01 | 0.02 | 13.87 |
| 2016 | 0.29 | 7.29 | 3.24 | 1.41 | 3.35 | 2.01 | 3.65 | 2.65 | 0.50 | 2.38 | 26.77 |
| 2015 | 0.98 | 5.98 | 7.59 | 2.35 | 1.93 | 1.51 | 0.32 | 2.80 | 1.90 | 4.92 | 30.28 |
| 2014 | 3.13 | 3.87 | 4.64 | 3.42 | 3.16 | 4.49 | 6.66 | 1.48 | 2.09 | 0.55 | 33.49 |
| 2013 | 2.45 | 1.33 | 5.21 | 4.58 | 7.74 | 0.28 | 2.13 | 2.66 | 0.77 | 2.60 | 29.75 |
| 2012 | 0.42 | 2.23 | 1.77 | 5.39 | 4.20 | 0.17 | 2.41 | 1.01 | 3.71 | 3.46 | 24.77 |
| 2011 | 1.34 | 2.20 | 6.83 | 0.66 | 0.58 | 4.03 | 1.91 | 0.22 | 1.36 | 1.15 | 20.28 |
| 2010 | 3.10 | 2.95 | 3.81 | 1.94 | 3.51 | 3.21 | 0.77 | 3.42 | 2.21 | 5.87 | 30.79 |
| 2009 | 3.14 | 1.22 | 3.51 | 12.74 | 1.91 | 1.34 | 0.66 | 1.23 | 2.91 | 1.99 | 30.65 |
| 2008 | 3.57 | 0.67 | 0.37 | 3.84 | 3.93 | 1.75 | 1.99 | 3.61 | 0.73 | 0.55 | 21.01 |
| 2007 | 0.99 | 0.16 | 2.30 | 1.02 | 3.87 | 2.65 | 0.76 | 4.50 | 1.33 | 3.18 | 20.75 |
| 2006 | 2.46 | 2.88 | 0.40 | 0.74 | 0.90 | 1.35 | 2.43 | 0.59 | 8.46 | 0.83 | 21.04 |
| 2005 | 0.06 | 0.65 | 0.77 | 5.75 | 2.75 | 0.81 | 0.49 | 2.14 | 4.24 | 4.59 | 22.25 |
| 2004 | 2.20 | 2.36 | 0.29 | 5.04 | 3.86 | 0.63 | 0.34 | 1.98 | 0.81 | 3.02 | 20.53 |
| 2003 | 0.91 | 0,01 | 0.28 | 2.51 | 0.94 | 1.66 | 0.90 | 1.45 | 1.03 | 2.63 | 12.32 |
| 2002 | 0.35 | 5.87 | 2.86 | 3.51 | 6.48 | 1.44 | 4.45 | 6.74 | 5.58 | 2.82 | 40.10 |
| 2001 | 1.57 | 1.52 | 3.15 | 0.53 | 4.12 | 1.04 | 0.98 | 1.54 | 1.84 | 1.82 | 18.11 |
| 2000 | 0.50 | 0.03 | 1.35 | 7.21 | 3.50 | 2.99 | 1.67 | 3.79 | 4.24 | 5.18 | 30.46 |
| Average | 1.94 | 2.79 | 3.93 | 3.73 | 3.42 | 2.14 | 2.13 | 2.36 | 1.75 | 2.67 | 26.85 |
Monthly heat summation for T>50°F
< 2007-2016 average
> 2007-2016 average
| Vintage | January | February | March | April | May | June | July | August | September | October | Total |
|---|---|---|---|---|---|---|---|---|---|---|---|
| 2024 | 6.8 | 42.5 | 107.5 | 225.5 | 395.0 | 601.4 | 895.0 | 925.2 | 488.9 | 296.6 | 3984.3 |
| 2023 | 0.2 | 31.3 | 120.1 | 242.1 | 444.6 | 706.6 | 910.9 | 921.7 | 660.5 | 445.2 | 4483.2 |
| 2022 | 2.6 | 20.7 | 64.8 | 218.6 | 561.5 | 820.7 | 990.2 | 902.2 | 593.3 | 471.3 | 4645.9 |
| 2021 | 0.5 | 36.5 | 84.5 | 144.5 | 370.4 | 735.3 | 830.3 | 824.7 | 648.7 | 252.1 | 3927.5 |
| 2020 | 3.0 | 35.0 | 66.5 | 263.0 | 486.4 | 603.1 | 811.5 | 846.2 | 589.6 | 205.0 | 3909.3 |
| 2019 | 0.5 | 22.2 | 101.5 | 155.9 | 284.3 | 740.2 | 852.2 | 782.9 | 541.6 | 282.7 | 3764.0 |
| 2018 | 0.0 | 0.0 | 23.7 | 291.3 | 430.1 | 668.3 | 848.6 | 852.5 | 629.4 | 288.8 | 4032.7 |
| 2017 | 0.0 | 0.5 | 145.5 | 211.7 | 459.5 | 757.2 | 835.4 | 890.4 | 474.8 | 332.3 | 4107.3 |
| 2016 | 3.9 | 5.0 | 50.3 | 228.5 | 367.8 | 621.7 | 825.8 | 781.9 | 632.0 | 189.4 | 3706.3 |
| 2015 | 15.1 | 0.0 | 69.4 | 227.1 | 462.7 | 680.5 | 957.0 | 779.6 | 478.0 | 202.7 | 3872.2 |
| 2014 | 0.8 | 0.4 | 110.5 | 229.5 | 368.4 | 622.4 | 672.3 | 676.7 | 524.0 | 305.9 | 3510.9 |
| 2013 | 14.2 | 0.0 | 8.7 | 211.0 | 331.7 | 619.1 | 840.3 | 790.1 | 546.8 | 220.4 | 3582.3 |
| 2012 | 1.3 | 21.7 | 215.6 | 142.1 | 429.2 | 716.3 | 821.1 | 880.4 | 503.4 | 299.4 | 4030.3 |
| 2011 | 0.0 | 5.9 | 68.5 | 362.3 | 542.5 | 606.6 | 719.2 | 860.0 | 694.7 | 277.5 | 4137.2 |
| 2010 | 0.0 | 2.0 | 47.0 | 210.6 | 401.6 | 631.4 | 893.0 | 720.0 | 493.9 | 176.9 | 3576.1 |
| 2009 | 0.0 | 0.0 | 54.7 | 209.3 | 569.0 | 674.8 | 802.6 | 854.3 | 577.3 | 288.5 | 4030.6 |
| 2008 | 8.6 | 4.0 | 69.3 | 123.1 | 396.9 | 621.9 | 754.7 | 754.6 | 463.0 | 269.8 | 3465.7 |
| 2007 | 13.9 | 12.4 | 86.6 | 326.0 | 482.8 | 605.5 | 803.2 | 690.1 | 449.8 | 216.7 | 3687.1 |
| 2006 | 0.0 | 0.0 | 33.8 | 209.9 | 410.0 | 563.9 | 910.3 | 669.8 | 578.0 | 326.0 | 3701.5 |
| 2005 | 2.3 | 0.0 | 92.9 | 126.2 | 475.4 | 676.4 | 794.3 | 682.7 | 499.1 | 164.9 | 3514.0 |
| 2004 | 0.4 | 2.0 | 44.6 | 146.9 | 325.8 | 628.4 | 736.0 | 757.6 | 556.0 | 260.3 | 3457.8 |
| 2003 | 1.1 | 0.0 | 62.6 | 164.2 | 502.4 | 824.4 | 854.3 | 961.0 | 470.7 | 148.9 | 3989.3 |
| 2002 | 0.0 | 0.7 | 100.1 | 163.4 | 367.0 | 683.5 | 682.4 | 658.8 | 431.8 | 193.1 | 3280.7 |
| 2001 | 0.0 | 13.0 | 80.8 | 101.5 | 441.4 | 579.1 | 742.7 | 814.7 | 358.9 | 344.9 | 3476.9 |
| 2000 | 2.7 | 0.2 | 73.6 | 160.2 | 470.9 | 654.1 | 656.8 | 755.8 | 544.1 | 216.4 | 3534.8 |
| Average | 5.8 | 5.1 | 78.0 | 226.9 | 435.3 | 640.0 | 808.9 | 778.8 | 536.3 | 244.7 | 3759.8 |
Days of rain per month
Distribution of Rainfall and Harvest Starting Dates