Vintage 2015
Vintage 2015
Vintage Report · The Climate and the Harvest
Rating
Harvest period
Early
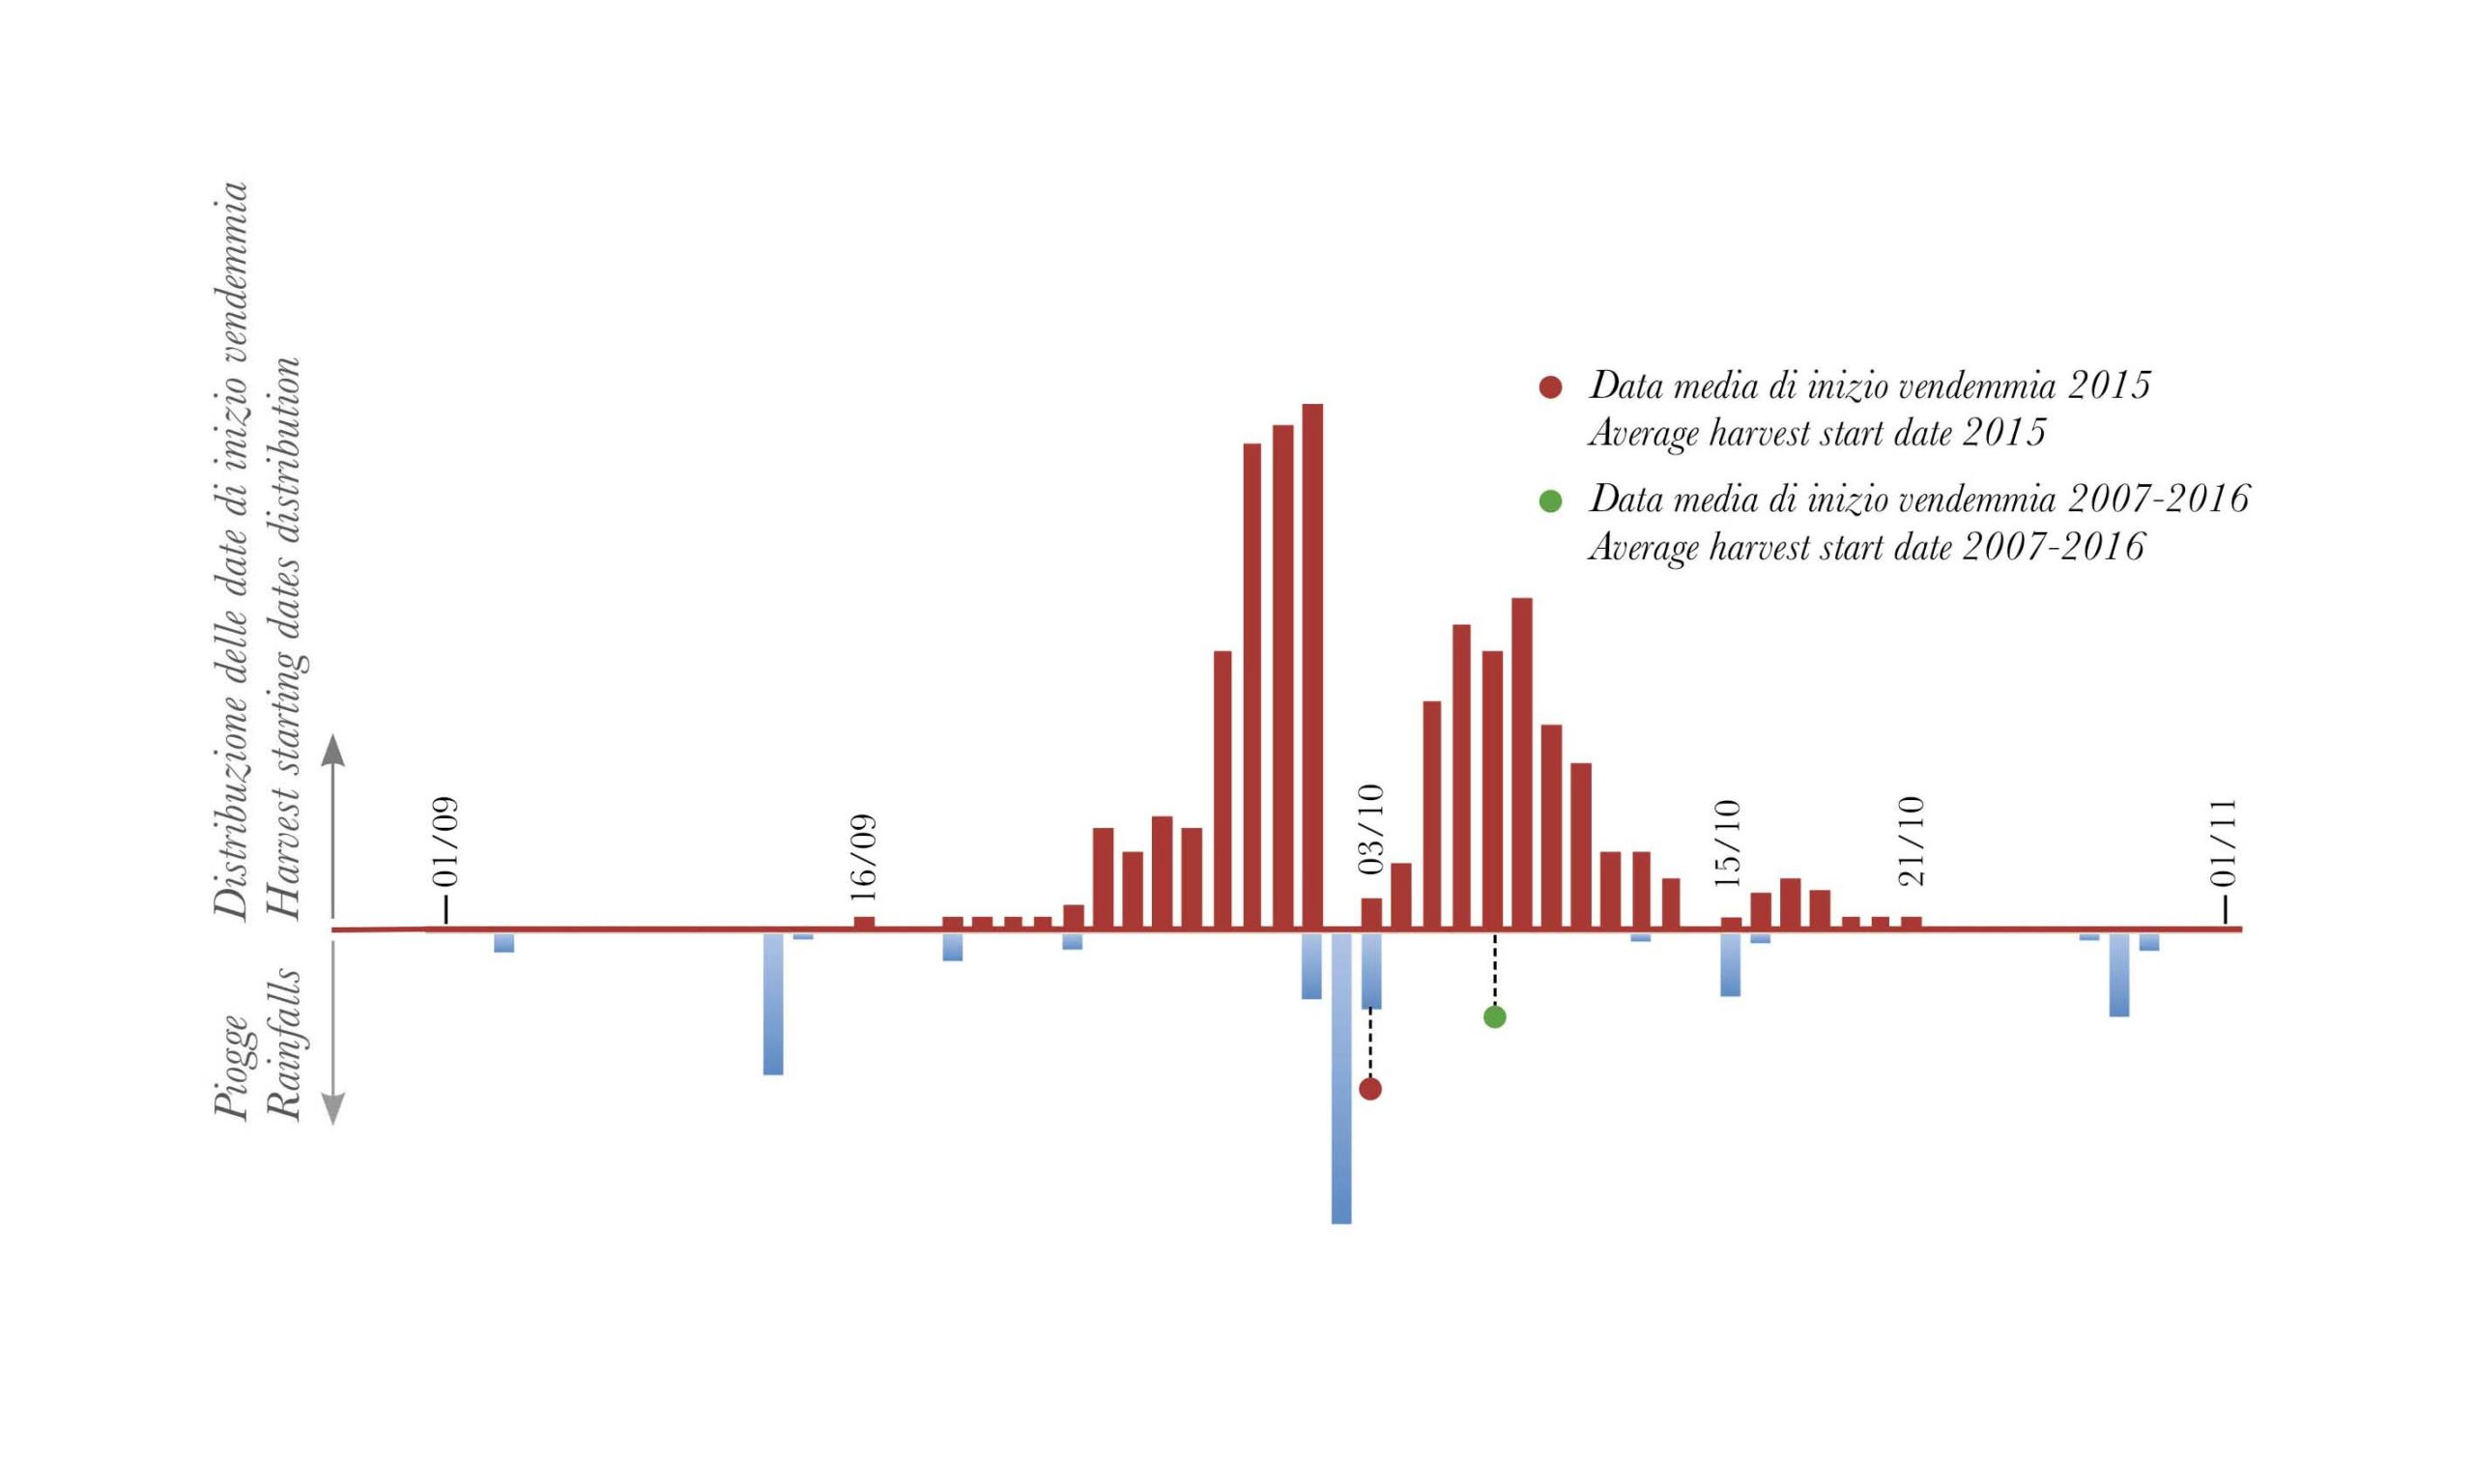
Average harvest starting date
10/03/2015 (Oct. 7)
Days of rain (Jan.- Oct.)
68 (62)
Total rainfall (Jan.- Oct.)
30.28 in (26.85)
Heat summation T>50°F (Jan.- Oct.)
3872.2 (3759.8)
After the reassuring normality of a vintage such as the 2016, here we have another which seems more an unusual one, though with characteristics and timing a bit different from those of the year 2017. What distinguished it were, in particular, the months of May, June, and July, characterized in the case of the first two by successive heat waves along with sudden drops of temperature. July was not like this, marked as it was by intense and persistent heat and by an almost total lack of rainfall (as moreover can be deduced from the graph and by the table here below).
Fortunately, what was shaping up as a worrisome overall picture was in good part compensated by a month of August which, though remaining warm, was less so than the preceding one and, above all, was mitigated by eight whole days of rain, a rather unusual figure for the period. A month of September which was a normal one both in terms of temperatures and precipitation did the rest, preventing in this way that the vintage would take on a character, in terms of aroma and flavor as well, which might have resembled that of 2003. The same rains of early October, rather intense and right in the middle of the picking, appear not to have had negative effects, allowing the harvest to terminate in the best fashion possible, though in a longer time span than initially expected.
The wines. Since there has been a lot of talk about Barolo 2014, and even more talk about Barolo 2016, the 2015 vintage has not been given the emphasis it deserves, almost to the point of being ignored in silence. In reality it is a vintage of definite value, with wines that are sometimes full-bodied and sometimes precocious and elegant, but always with character. The style of the various crus emerges quite clearly and with regularity.
Monthly rainfall in inches
< 2007-2016 average
> 2007-2016 average
| Vintage | January | February | March | April | May | June | July | August | September | October | Total |
|---|---|---|---|---|---|---|---|---|---|---|---|
| 2024 | 1.28 | 4.23 | 7.86 | 2.95 | 5.86 | 2.51 | 0.63 | 2.05 | 4.82 | 9.07 | 41.27 |
| 2023 | 0.44 | 0.74 | 1.17 | 0.48 | 9.23 | 4.58 | 0.23 | 4.84 | 1.14 | 1.97 | 24.82 |
| 2022 | 0.06 | 0.09 | 1.18 | 0.59 | 4.00 | 1.92 | 2.12 | 1.17 | 1.19 | 1.24 | 13.56 |
| 2021 | 5.40 | 0.81 | 0.17 | 1.98 | 0.89 | 1.48 | 2.08 | 0.08 | 1.00 | 1.19 | 15.08 |
| 2020 | 0.58 | 0.02 | 0.99 | 3.29 | 4.51 | 3.21 | 2.13 | 2.52 | 1.83 | 4.52 | 23.60 |
| 2019 | 0.62 | 0.89 | 0.04 | 6.58 | 4.53 | 0.31 | 5.41 | 0.51 | 3.73 | 3.16 | 25.77 |
| 2018 | 3.69 | 4.06 | 4.25 | 4.18 | 6.63 | 1.88 | 1.22 | 1.29 | 2.60 | 6.56 | 36.36 |
| 2017 | 0.41 | 2.72 | 2.45 | 2.28 | 1.89 | 1.26 | 1.79 | 0.04 | 1.01 | 0.02 | 13.87 |
| 2016 | 0.29 | 7.29 | 3.24 | 1.41 | 3.35 | 2.01 | 3.65 | 2.65 | 0.50 | 2.38 | 26.77 |
| 2015 | 0.98 | 5.98 | 7.59 | 2.35 | 1.93 | 1.51 | 0.32 | 2.80 | 1.90 | 4.92 | 30.28 |
| 2014 | 3.13 | 3.87 | 4.64 | 3.42 | 3.16 | 4.49 | 6.66 | 1.48 | 2.09 | 0.55 | 33.49 |
| 2013 | 2.45 | 1.33 | 5.21 | 4.58 | 7.74 | 0.28 | 2.13 | 2.66 | 0.77 | 2.60 | 29.75 |
| 2012 | 0.42 | 2.23 | 1.77 | 5.39 | 4.20 | 0.17 | 2.41 | 1.01 | 3.71 | 3.46 | 24.77 |
| 2011 | 1.34 | 2.20 | 6.83 | 0.66 | 0.58 | 4.03 | 1.91 | 0.22 | 1.36 | 1.15 | 20.28 |
| 2010 | 3.10 | 2.95 | 3.81 | 1.94 | 3.51 | 3.21 | 0.77 | 3.42 | 2.21 | 5.87 | 30.79 |
| 2009 | 3.14 | 1.22 | 3.51 | 12.74 | 1.91 | 1.34 | 0.66 | 1.23 | 2.91 | 1.99 | 30.65 |
| 2008 | 3.57 | 0.67 | 0.37 | 3.84 | 3.93 | 1.75 | 1.99 | 3.61 | 0.73 | 0.55 | 21.01 |
| 2007 | 0.99 | 0.16 | 2.30 | 1.02 | 3.87 | 2.65 | 0.76 | 4.50 | 1.33 | 3.18 | 20.75 |
| 2006 | 2.46 | 2.88 | 0.40 | 0.74 | 0.90 | 1.35 | 2.43 | 0.59 | 8.46 | 0.83 | 21.04 |
| 2005 | 0.06 | 0.65 | 0.77 | 5.75 | 2.75 | 0.81 | 0.49 | 2.14 | 4.24 | 4.59 | 22.25 |
| 2004 | 2.20 | 2.36 | 0.29 | 5.04 | 3.86 | 0.63 | 0.34 | 1.98 | 0.81 | 3.02 | 20.53 |
| 2003 | 0.91 | 0,01 | 0.28 | 2.51 | 0.94 | 1.66 | 0.90 | 1.45 | 1.03 | 2.63 | 12.32 |
| 2002 | 0.35 | 5.87 | 2.86 | 3.51 | 6.48 | 1.44 | 4.45 | 6.74 | 5.58 | 2.82 | 40.10 |
| 2001 | 1.57 | 1.52 | 3.15 | 0.53 | 4.12 | 1.04 | 0.98 | 1.54 | 1.84 | 1.82 | 18.11 |
| 2000 | 0.50 | 0.03 | 1.35 | 7.21 | 3.50 | 2.99 | 1.67 | 3.79 | 4.24 | 5.18 | 30.46 |
| Average | 1.94 | 2.79 | 3.93 | 3.73 | 3.42 | 2.14 | 2.13 | 2.36 | 1.75 | 2.67 | 26.85 |
Monthly heat summation for T>50°F
< 2007-2016 average
> 2007-2016 average
| Vintage | January | February | March | April | May | June | July | August | September | October | Total |
|---|---|---|---|---|---|---|---|---|---|---|---|
| 2024 | 6.8 | 42.5 | 107.5 | 225.5 | 395.0 | 601.4 | 895.0 | 925.2 | 488.9 | 296.6 | 3984.3 |
| 2023 | 0.2 | 31.3 | 120.1 | 242.1 | 444.6 | 706.6 | 910.9 | 921.7 | 660.5 | 445.2 | 4483.2 |
| 2022 | 2.6 | 20.7 | 64.8 | 218.6 | 561.5 | 820.7 | 990.2 | 902.2 | 593.3 | 471.3 | 4645.9 |
| 2021 | 0.5 | 36.5 | 84.5 | 144.5 | 370.4 | 735.3 | 830.3 | 824.7 | 648.7 | 252.1 | 3927.5 |
| 2020 | 3.0 | 35.0 | 66.5 | 263.0 | 486.4 | 603.1 | 811.5 | 846.2 | 589.6 | 205.0 | 3909.3 |
| 2019 | 0.5 | 22.2 | 101.5 | 155.9 | 284.3 | 740.2 | 852.2 | 782.9 | 541.6 | 282.7 | 3764.0 |
| 2018 | 0.0 | 0.0 | 23.7 | 291.3 | 430.1 | 668.3 | 848.6 | 852.5 | 629.4 | 288.8 | 4032.7 |
| 2017 | 0.0 | 0.5 | 145.5 | 211.7 | 459.5 | 757.2 | 835.4 | 890.4 | 474.8 | 332.3 | 4107.3 |
| 2016 | 3.9 | 5.0 | 50.3 | 228.5 | 367.8 | 621.7 | 825.8 | 781.9 | 632.0 | 189.4 | 3706.3 |
| 2015 | 15.1 | 0.0 | 69.4 | 227.1 | 462.7 | 680.5 | 957.0 | 779.6 | 478.0 | 202.7 | 3872.2 |
| 2014 | 0.8 | 0.4 | 110.5 | 229.5 | 368.4 | 622.4 | 672.3 | 676.7 | 524.0 | 305.9 | 3510.9 |
| 2013 | 14.2 | 0.0 | 8.7 | 211.0 | 331.7 | 619.1 | 840.3 | 790.1 | 546.8 | 220.4 | 3582.3 |
| 2012 | 1.3 | 21.7 | 215.6 | 142.1 | 429.2 | 716.3 | 821.1 | 880.4 | 503.4 | 299.4 | 4030.3 |
| 2011 | 0.0 | 5.9 | 68.5 | 362.3 | 542.5 | 606.6 | 719.2 | 860.0 | 694.7 | 277.5 | 4137.2 |
| 2010 | 0.0 | 2.0 | 47.0 | 210.6 | 401.6 | 631.4 | 893.0 | 720.0 | 493.9 | 176.9 | 3576.1 |
| 2009 | 0.0 | 0.0 | 54.7 | 209.3 | 569.0 | 674.8 | 802.6 | 854.3 | 577.3 | 288.5 | 4030.6 |
| 2008 | 8.6 | 4.0 | 69.3 | 123.1 | 396.9 | 621.9 | 754.7 | 754.6 | 463.0 | 269.8 | 3465.7 |
| 2007 | 13.9 | 12.4 | 86.6 | 326.0 | 482.8 | 605.5 | 803.2 | 690.1 | 449.8 | 216.7 | 3687.1 |
| 2006 | 0.0 | 0.0 | 33.8 | 209.9 | 410.0 | 563.9 | 910.3 | 669.8 | 578.0 | 326.0 | 3701.5 |
| 2005 | 2.3 | 0.0 | 92.9 | 126.2 | 475.4 | 676.4 | 794.3 | 682.7 | 499.1 | 164.9 | 3514.0 |
| 2004 | 0.4 | 2.0 | 44.6 | 146.9 | 325.8 | 628.4 | 736.0 | 757.6 | 556.0 | 260.3 | 3457.8 |
| 2003 | 1.1 | 0.0 | 62.6 | 164.2 | 502.4 | 824.4 | 854.3 | 961.0 | 470.7 | 148.9 | 3989.3 |
| 2002 | 0.0 | 0.7 | 100.1 | 163.4 | 367.0 | 683.5 | 682.4 | 658.8 | 431.8 | 193.1 | 3280.7 |
| 2001 | 0.0 | 13.0 | 80.8 | 101.5 | 441.4 | 579.1 | 742.7 | 814.7 | 358.9 | 344.9 | 3476.9 |
| 2000 | 2.7 | 0.2 | 73.6 | 160.2 | 470.9 | 654.1 | 656.8 | 755.8 | 544.1 | 216.4 | 3534.8 |
| Average | 5.8 | 5.1 | 78.0 | 226.9 | 435.3 | 640.0 | 808.9 | 778.8 | 536.3 | 244.7 | 3759.8 |
Days of rain per month
Distribution of Rainfall and Harvest Starting Dates