Vintage 2014
Vintage 2014
Vintage Report · The Climate and the Harvest
Rating
Harvest period
Late
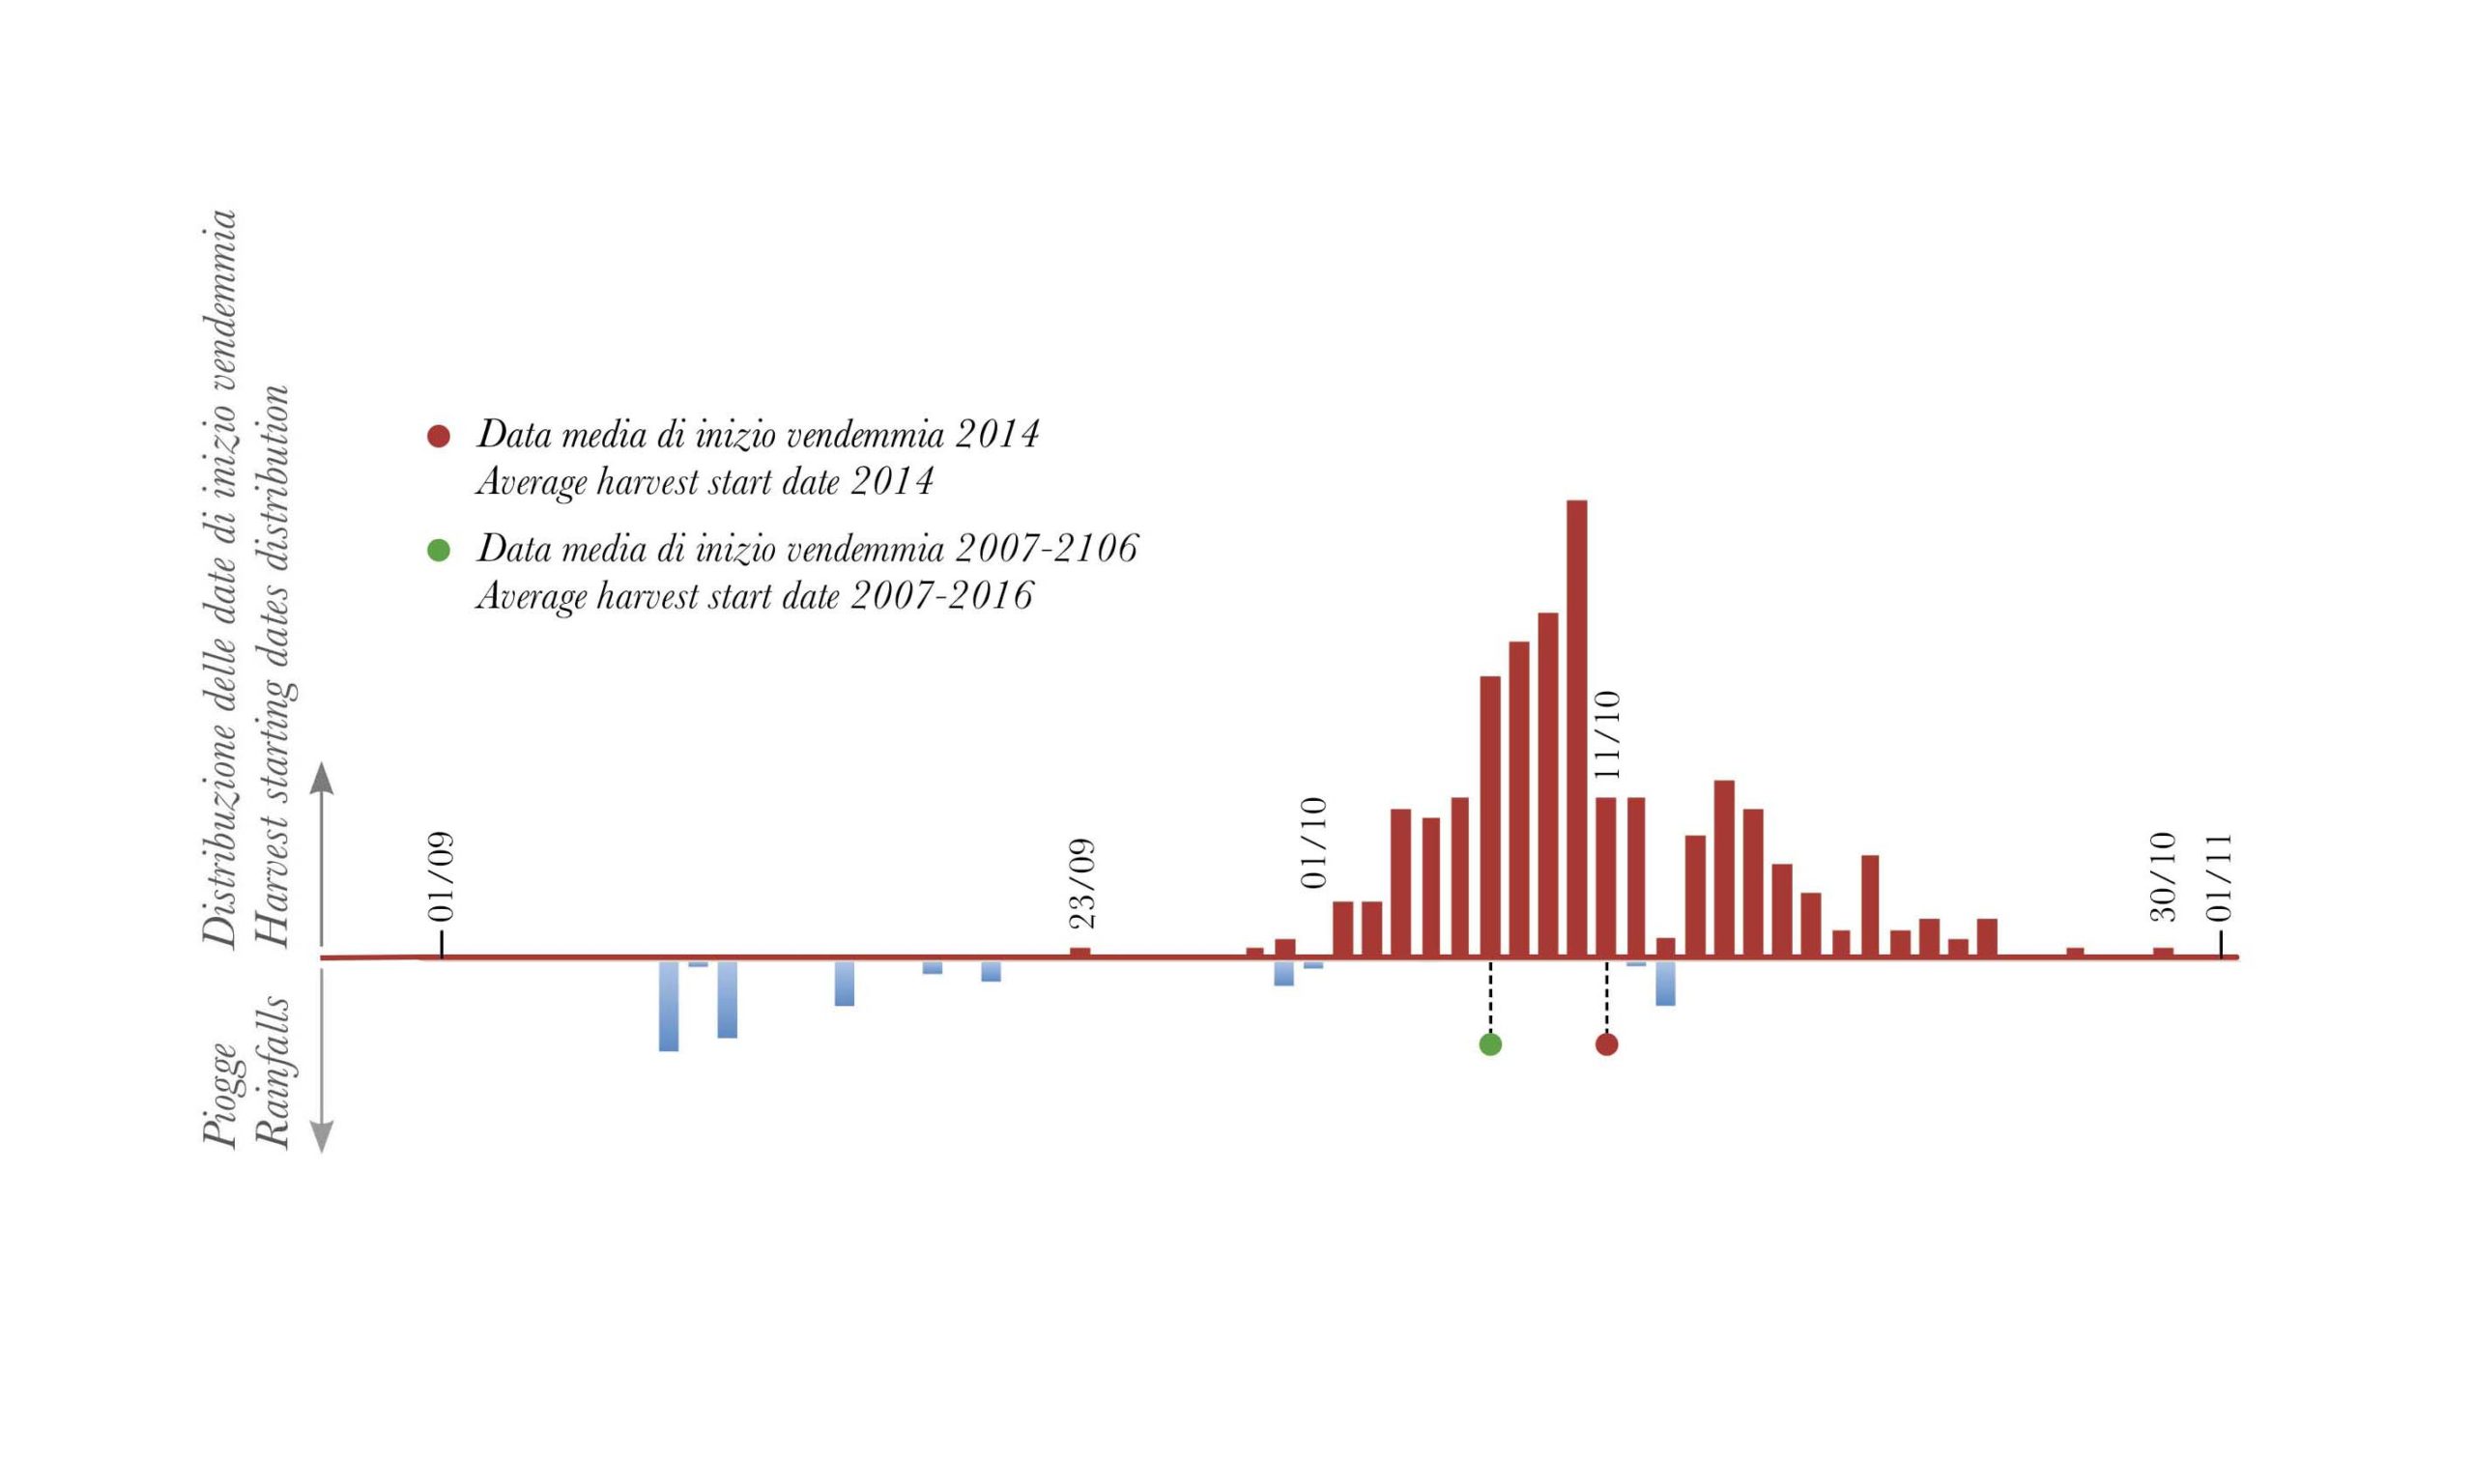
Average harvest starting date
10/11/2014 (Oct. 7)
Days of rain (Jan.- Oct.)
77 (62)
Total rainfall (Jan.- Oct.)
33.50 in (26.85)
Heat summation T>50°F (Jan.- Oct.)
3510.9 (3759.8)
The rains during the harvest period, which in the two preceding years (2015 and 2016) did not create problems, would in this case have been the coup de grâce for a vintage which was already a complicated one.
After a precocious early growing season due to rather mild weather in April and an initial part of June which registered the hottest temperatures of the entire growing season, the climate, in fact, gradually presented a series of more and more marked and decisive anomalies. First the rains of late June which continued and increased well beyond the period averages of the month of July and then the very cool weather which characterized both July and August along with frequent cloud cover and rather high levels of humidity.
To rescue a vintage which seemed already compromised was the arrival, however, of a month of September which on one hand was characterized by an above average number of days of rain and, on the other hand, by heat summations which were rather positive and which allowed a late-ripening variety such as Nebbiolo to recover some lost ground, at least in terms of quality. And, apropos of quality, it is important to recall as well the hailstorms of early July which, in the case of certain houses and certain specific vineyards significantly compromised the quality and the size of the harvest.
The wines. A difficult vintage, but not to the extent of 2002. The nervous character and the crunchy fruit recall the Nebbiolo of cooler zones such as Gattinara and the Valtellina even if examples of more full-bodied Barolo are not lacking. All in all, though the wines of an average vintage are out of fashion today, I would try to give it a chance by focusing on the innate qualities of Nebbiolo and the capacity to transform the limitations of a vintage into originality and therefore value.Also because some wines deserve (much) more than the overall evaluation assigned to the vintage.
Monthly rainfall in inches
< 2007-2016 average
> 2007-2016 average
| Vintage | January | February | March | April | May | June | July | August | September | October | Total |
|---|---|---|---|---|---|---|---|---|---|---|---|
| 2024 | 1.28 | 4.23 | 7.86 | 2.95 | 5.86 | 2.51 | 0.63 | 2.05 | 4.82 | 9.07 | 41.27 |
| 2023 | 0.44 | 0.74 | 1.17 | 0.48 | 9.23 | 4.58 | 0.23 | 4.84 | 1.14 | 1.97 | 24.82 |
| 2022 | 0.06 | 0.09 | 1.18 | 0.59 | 4.00 | 1.92 | 2.12 | 1.17 | 1.19 | 1.24 | 13.56 |
| 2021 | 5.40 | 0.81 | 0.17 | 1.98 | 0.89 | 1.48 | 2.08 | 0.08 | 1.00 | 1.19 | 15.08 |
| 2020 | 0.58 | 0.02 | 0.99 | 3.29 | 4.51 | 3.21 | 2.13 | 2.52 | 1.83 | 4.52 | 23.60 |
| 2019 | 0.62 | 0.89 | 0.04 | 6.58 | 4.53 | 0.31 | 5.41 | 0.51 | 3.73 | 3.16 | 25.77 |
| 2018 | 3.69 | 4.06 | 4.25 | 4.18 | 6.63 | 1.88 | 1.22 | 1.29 | 2.60 | 6.56 | 36.36 |
| 2017 | 0.41 | 2.72 | 2.45 | 2.28 | 1.89 | 1.26 | 1.79 | 0.04 | 1.01 | 0.02 | 13.87 |
| 2016 | 0.29 | 7.29 | 3.24 | 1.41 | 3.35 | 2.01 | 3.65 | 2.65 | 0.50 | 2.38 | 26.77 |
| 2015 | 0.98 | 5.98 | 7.59 | 2.35 | 1.93 | 1.51 | 0.32 | 2.80 | 1.90 | 4.92 | 30.28 |
| 2014 | 3.13 | 3.87 | 4.64 | 3.42 | 3.16 | 4.49 | 6.66 | 1.48 | 2.09 | 0.55 | 33.49 |
| 2013 | 2.45 | 1.33 | 5.21 | 4.58 | 7.74 | 0.28 | 2.13 | 2.66 | 0.77 | 2.60 | 29.75 |
| 2012 | 0.42 | 2.23 | 1.77 | 5.39 | 4.20 | 0.17 | 2.41 | 1.01 | 3.71 | 3.46 | 24.77 |
| 2011 | 1.34 | 2.20 | 6.83 | 0.66 | 0.58 | 4.03 | 1.91 | 0.22 | 1.36 | 1.15 | 20.28 |
| 2010 | 3.10 | 2.95 | 3.81 | 1.94 | 3.51 | 3.21 | 0.77 | 3.42 | 2.21 | 5.87 | 30.79 |
| 2009 | 3.14 | 1.22 | 3.51 | 12.74 | 1.91 | 1.34 | 0.66 | 1.23 | 2.91 | 1.99 | 30.65 |
| 2008 | 3.57 | 0.67 | 0.37 | 3.84 | 3.93 | 1.75 | 1.99 | 3.61 | 0.73 | 0.55 | 21.01 |
| 2007 | 0.99 | 0.16 | 2.30 | 1.02 | 3.87 | 2.65 | 0.76 | 4.50 | 1.33 | 3.18 | 20.75 |
| 2006 | 2.46 | 2.88 | 0.40 | 0.74 | 0.90 | 1.35 | 2.43 | 0.59 | 8.46 | 0.83 | 21.04 |
| 2005 | 0.06 | 0.65 | 0.77 | 5.75 | 2.75 | 0.81 | 0.49 | 2.14 | 4.24 | 4.59 | 22.25 |
| 2004 | 2.20 | 2.36 | 0.29 | 5.04 | 3.86 | 0.63 | 0.34 | 1.98 | 0.81 | 3.02 | 20.53 |
| 2003 | 0.91 | 0,01 | 0.28 | 2.51 | 0.94 | 1.66 | 0.90 | 1.45 | 1.03 | 2.63 | 12.32 |
| 2002 | 0.35 | 5.87 | 2.86 | 3.51 | 6.48 | 1.44 | 4.45 | 6.74 | 5.58 | 2.82 | 40.10 |
| 2001 | 1.57 | 1.52 | 3.15 | 0.53 | 4.12 | 1.04 | 0.98 | 1.54 | 1.84 | 1.82 | 18.11 |
| 2000 | 0.50 | 0.03 | 1.35 | 7.21 | 3.50 | 2.99 | 1.67 | 3.79 | 4.24 | 5.18 | 30.46 |
| Average | 1.94 | 2.79 | 3.93 | 3.73 | 3.42 | 2.14 | 2.13 | 2.36 | 1.75 | 2.67 | 26.85 |
Monthly heat summation for T>50°F
< 2007-2016 average
> 2007-2016 average
| Vintage | January | February | March | April | May | June | July | August | September | October | Total |
|---|---|---|---|---|---|---|---|---|---|---|---|
| 2024 | 6.8 | 42.5 | 107.5 | 225.5 | 395.0 | 601.4 | 895.0 | 925.2 | 488.9 | 296.6 | 3984.3 |
| 2023 | 0.2 | 31.3 | 120.1 | 242.1 | 444.6 | 706.6 | 910.9 | 921.7 | 660.5 | 445.2 | 4483.2 |
| 2022 | 2.6 | 20.7 | 64.8 | 218.6 | 561.5 | 820.7 | 990.2 | 902.2 | 593.3 | 471.3 | 4645.9 |
| 2021 | 0.5 | 36.5 | 84.5 | 144.5 | 370.4 | 735.3 | 830.3 | 824.7 | 648.7 | 252.1 | 3927.5 |
| 2020 | 3.0 | 35.0 | 66.5 | 263.0 | 486.4 | 603.1 | 811.5 | 846.2 | 589.6 | 205.0 | 3909.3 |
| 2019 | 0.5 | 22.2 | 101.5 | 155.9 | 284.3 | 740.2 | 852.2 | 782.9 | 541.6 | 282.7 | 3764.0 |
| 2018 | 0.0 | 0.0 | 23.7 | 291.3 | 430.1 | 668.3 | 848.6 | 852.5 | 629.4 | 288.8 | 4032.7 |
| 2017 | 0.0 | 0.5 | 145.5 | 211.7 | 459.5 | 757.2 | 835.4 | 890.4 | 474.8 | 332.3 | 4107.3 |
| 2016 | 3.9 | 5.0 | 50.3 | 228.5 | 367.8 | 621.7 | 825.8 | 781.9 | 632.0 | 189.4 | 3706.3 |
| 2015 | 15.1 | 0.0 | 69.4 | 227.1 | 462.7 | 680.5 | 957.0 | 779.6 | 478.0 | 202.7 | 3872.2 |
| 2014 | 0.8 | 0.4 | 110.5 | 229.5 | 368.4 | 622.4 | 672.3 | 676.7 | 524.0 | 305.9 | 3510.9 |
| 2013 | 14.2 | 0.0 | 8.7 | 211.0 | 331.7 | 619.1 | 840.3 | 790.1 | 546.8 | 220.4 | 3582.3 |
| 2012 | 1.3 | 21.7 | 215.6 | 142.1 | 429.2 | 716.3 | 821.1 | 880.4 | 503.4 | 299.4 | 4030.3 |
| 2011 | 0.0 | 5.9 | 68.5 | 362.3 | 542.5 | 606.6 | 719.2 | 860.0 | 694.7 | 277.5 | 4137.2 |
| 2010 | 0.0 | 2.0 | 47.0 | 210.6 | 401.6 | 631.4 | 893.0 | 720.0 | 493.9 | 176.9 | 3576.1 |
| 2009 | 0.0 | 0.0 | 54.7 | 209.3 | 569.0 | 674.8 | 802.6 | 854.3 | 577.3 | 288.5 | 4030.6 |
| 2008 | 8.6 | 4.0 | 69.3 | 123.1 | 396.9 | 621.9 | 754.7 | 754.6 | 463.0 | 269.8 | 3465.7 |
| 2007 | 13.9 | 12.4 | 86.6 | 326.0 | 482.8 | 605.5 | 803.2 | 690.1 | 449.8 | 216.7 | 3687.1 |
| 2006 | 0.0 | 0.0 | 33.8 | 209.9 | 410.0 | 563.9 | 910.3 | 669.8 | 578.0 | 326.0 | 3701.5 |
| 2005 | 2.3 | 0.0 | 92.9 | 126.2 | 475.4 | 676.4 | 794.3 | 682.7 | 499.1 | 164.9 | 3514.0 |
| 2004 | 0.4 | 2.0 | 44.6 | 146.9 | 325.8 | 628.4 | 736.0 | 757.6 | 556.0 | 260.3 | 3457.8 |
| 2003 | 1.1 | 0.0 | 62.6 | 164.2 | 502.4 | 824.4 | 854.3 | 961.0 | 470.7 | 148.9 | 3989.3 |
| 2002 | 0.0 | 0.7 | 100.1 | 163.4 | 367.0 | 683.5 | 682.4 | 658.8 | 431.8 | 193.1 | 3280.7 |
| 2001 | 0.0 | 13.0 | 80.8 | 101.5 | 441.4 | 579.1 | 742.7 | 814.7 | 358.9 | 344.9 | 3476.9 |
| 2000 | 2.7 | 0.2 | 73.6 | 160.2 | 470.9 | 654.1 | 656.8 | 755.8 | 544.1 | 216.4 | 3534.8 |
| Average | 5.8 | 5.1 | 78.0 | 226.9 | 435.3 | 640.0 | 808.9 | 778.8 | 536.3 | 244.7 | 3759.8 |
Days of rain per month
Distribution of Rainfall and Harvest Starting Dates