Vintage 2003
Vintage 2003
Vintage Report · The Climate and the Harvest
Rating
Harvest period
Very early
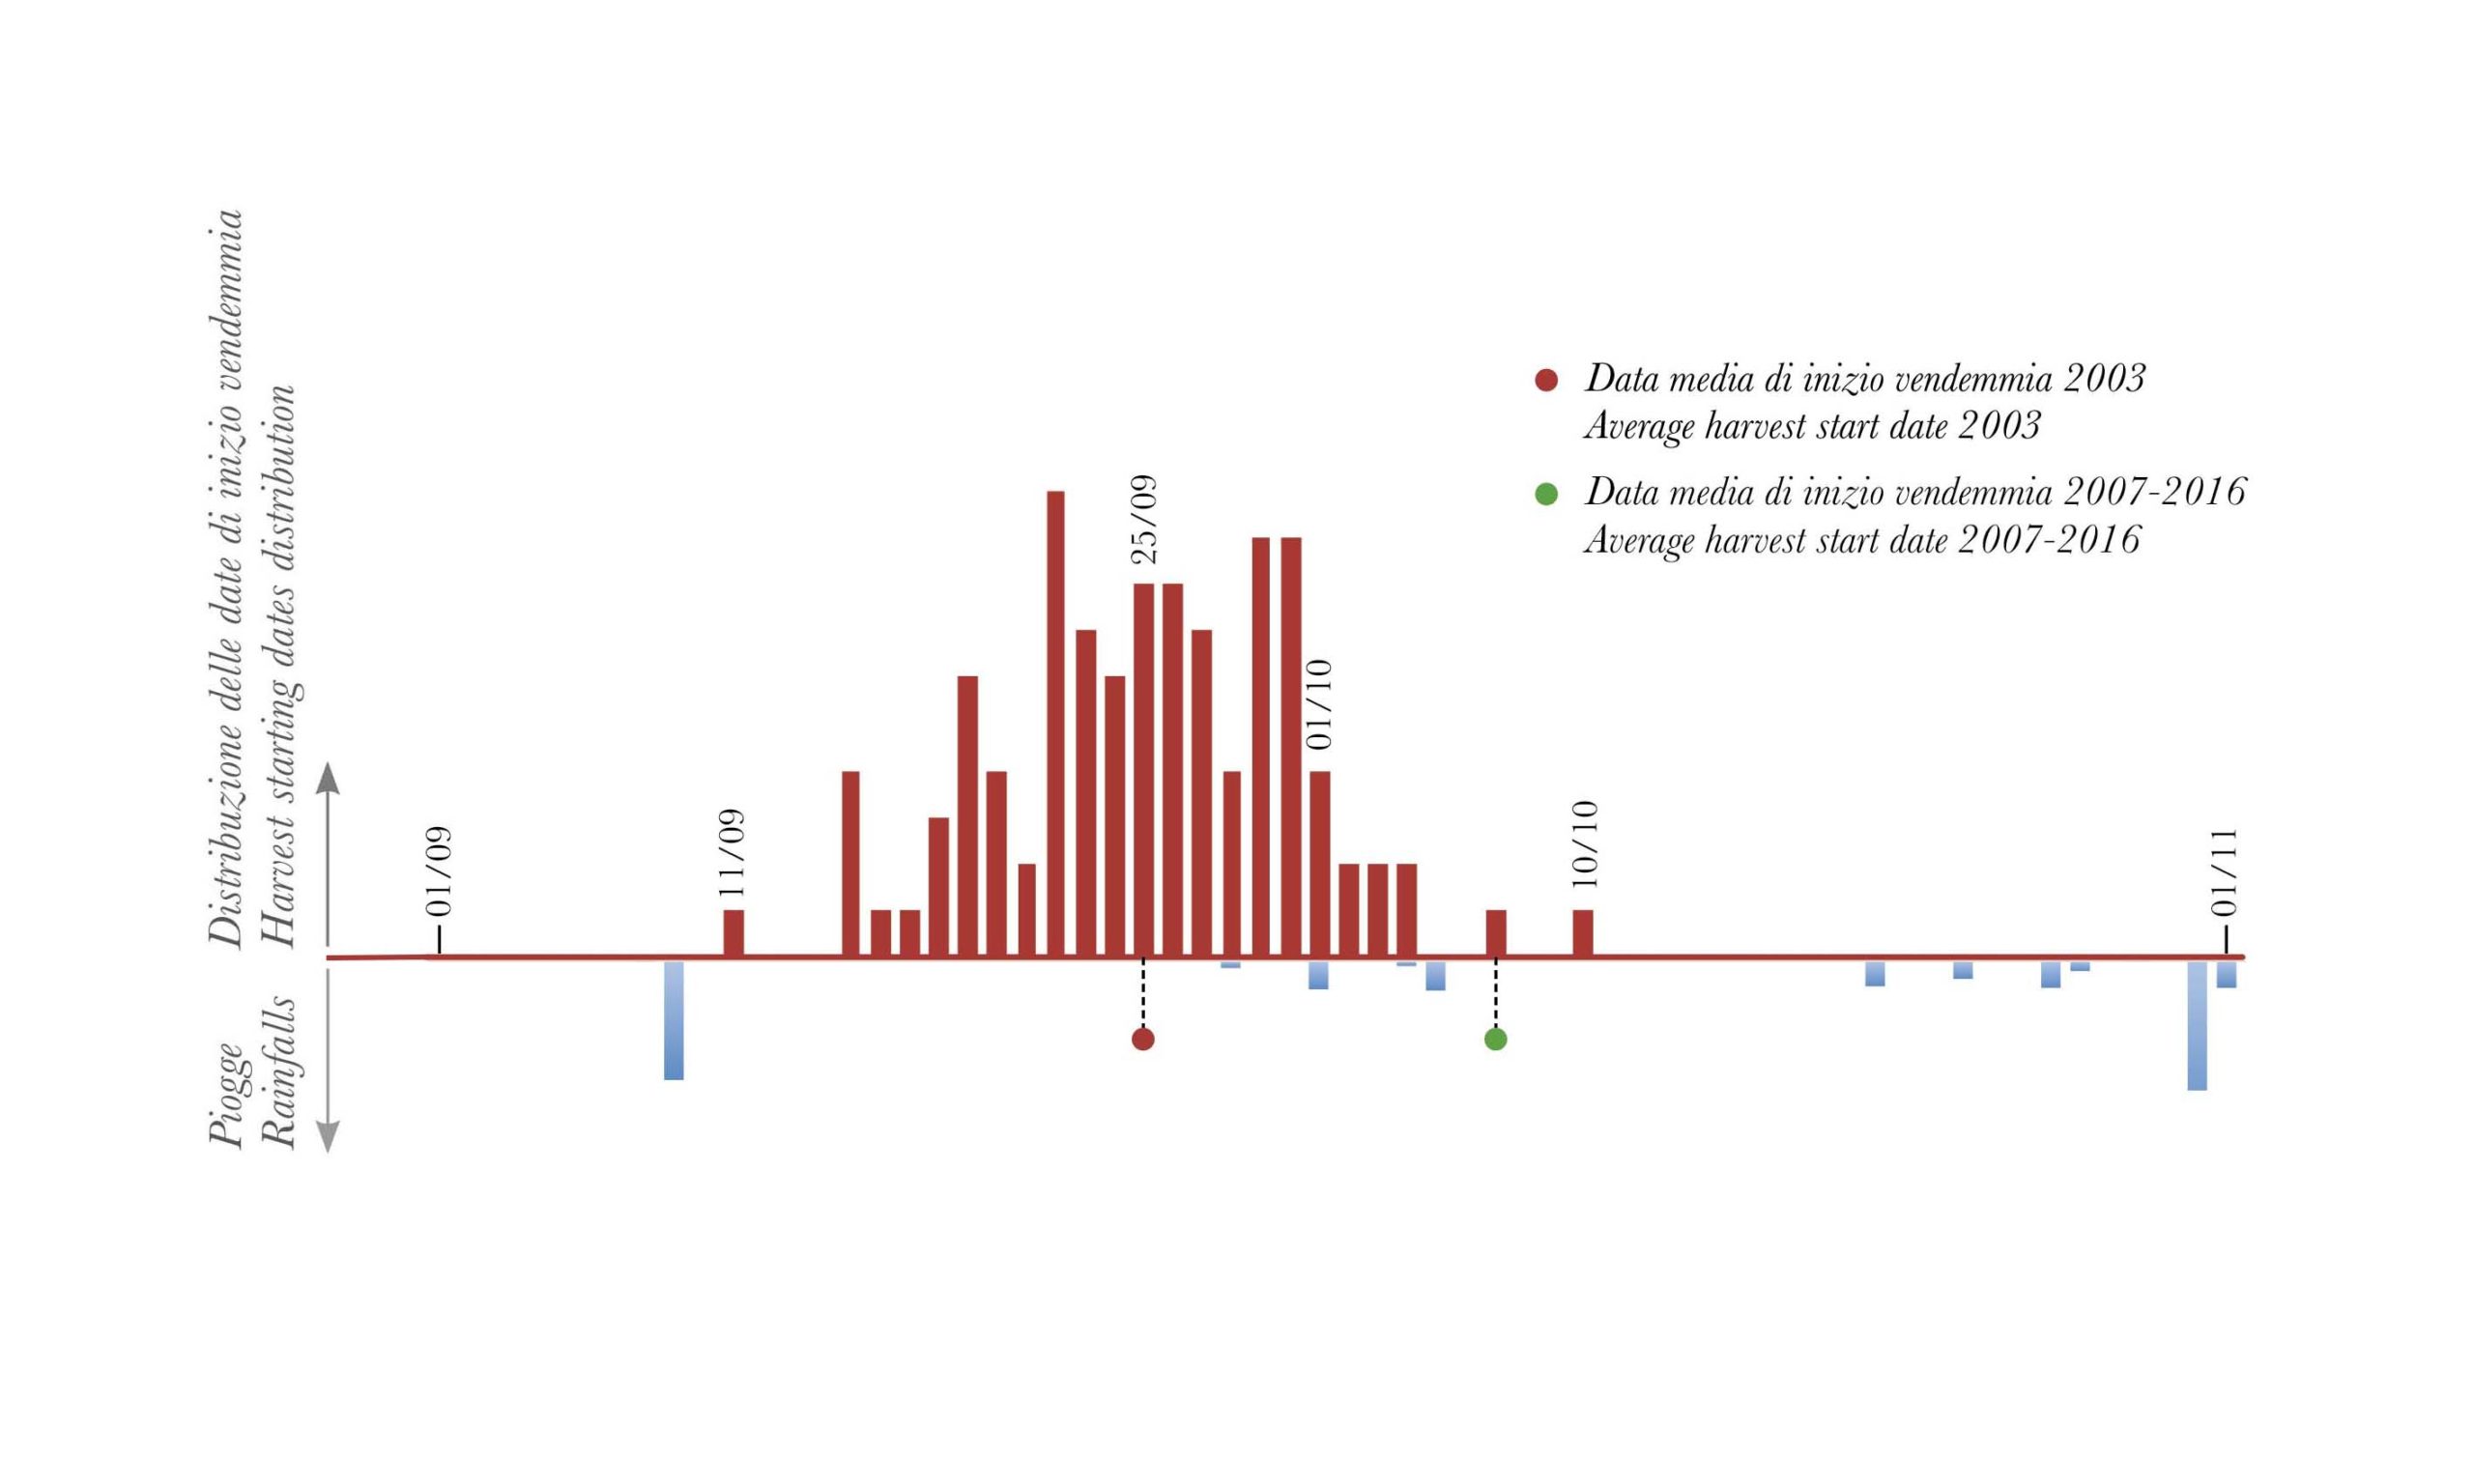
Average harvest starting date
09/25/2003 (Oct. 7th)
Days of rain (Jan.- Oct.)
36 (62)
Total rainfall (Jan.- Oct.)
12.30 in (26.85)
Heat summation T>50°F (Jan.- Oct.)
3989.3 (3759.8)
Along with the year 2017, this was unquestionably the most extreme vintage of all among those taken into consideration and – as we shall see – the one which more than any other characterized the wines with its distinctive timber. The overall rainfall, reduced to a bare minimum, and three consecutive months – June, July, and August – in which tropical temperatures dominated not only posed a tough challenge to the vines but to the producers as well, who after a vintage of this sort began to question their viticultural philosophy and practices. Coming from a difficult vintage such as the 2002, often saved by massive recourse to leaf removal, many growers, in 2003, repeated the same practices without being able to imagine that the course of the season would be the exact opposite of the preceding one. The result: many grape bunches remained literally cooked by the sun and the sugar levels, which went sky high, were not accompanied by an adequate maturation of the tannins. This was the cause of the unusual style of the wines, their notable imbalance in their youth, and the awareness on the part of the producers that each vintage needs a specific and well judged viticultural approach. The sole sporadic exceptions were those few growers who, in the 1997 and 2000 vintages, had been burned by these same phenomena and had learned from the experience.
The wines. Over-ripe and difficult in their youth, the 2003 Barolo wines, over the last few years, seem in many cases to have shed their excesses and found an expressiveness which is more balanced, complete, and deep, without losing the unmistakable timber of the vintage and compromising their aging ability. A metamorphosis which is therefore as positive as unexpected and which confirms once again that one of the great gifts of the Nebbiolo is its ability to express itself in a personal and original way even in the most complicated years.
Monthly rainfall in inches
< 2007-2016 average
> 2007-2016 average
| Vintage | January | February | March | April | May | June | July | August | September | October | Total |
|---|---|---|---|---|---|---|---|---|---|---|---|
| 2023 | 0.44 | 0.74 | 1.17 | 0.48 | 9.23 | 4.58 | 0.23 | 4.84 | 1.14 | 1.97 | 24.81 |
| 2022 | 0.06 | 0.09 | 1.18 | 0.59 | 4.00 | 1.92 | 2.12 | 1.17 | 1.19 | 1.24 | 13.57 |
| 2021 | 5.40 | 0.81 | 0.17 | 1.98 | 0.89 | 1.48 | 2.08 | 0.08 | 1.00 | 1.19 | 15.08 |
| 2020 | 0.59 | 0.02 | 0.99 | 3.29 | 4.51 | 3.21 | 2.13 | 2.52 | 1.83 | 4.52 | 23.61 |
| 2019 | 0.62 | 0.88 | 0.03 | 6.58 | 4.53 | 0.31 | 5.41 | 0.51 | 3.73 | 3.16 | 25.76 |
| 2018 | 3.69 | 4.06 | 4.25 | 4.18 | 6.63 | 1.88 | 1.22 | 1.29 | 2.60 | 6.56 | 36.36 |
| 2017 | 0.41 | 2.72 | 2.45 | 2.28 | 1.89 | 1.26 | 1.79 | 0.04 | 1.01 | 0.02 | 13.87 |
| 2016 | 0.29 | 7.29 | 3.24 | 1.41 | 3.35 | 2.00 | 3.65 | 2.65 | 0.50 | 2.37 | 26.77 |
| 2015 | 0.98 | 5.98 | 7.59 | 2.35 | 1.93 | 1.52 | 0.32 | 2.80 | 1.90 | 4.92 | 30.28 |
| 2014 | 3.13 | 3.87 | 4.64 | 3.42 | 3.16 | 4.49 | 6.67 | 1.48 | 2.09 | 0.56 | 33.50 |
| 2013 | 2.45 | 1.33 | 5.21 | 4.58 | 7.74 | 0.28 | 2.13 | 2.66 | 0.77 | 2.60 | 29.75 |
| 2012 | 0.42 | 2.23 | 1.77 | 5.39 | 4.20 | 0.17 | 2.41 | 1.01 | 3.70 | 3.46 | 24.77 |
| 2011 | 1.34 | 2.20 | 6.83 | 0.66 | 0.58 | 4.03 | 1.91 | 0.22 | 1.36 | 1.15 | 20.28 |
| 2010 | 3.10 | 2.95 | 3.81 | 1.94 | 3.52 | 3.21 | 0.77 | 3.42 | 2.21 | 5.87 | 30.79 |
| 2009 | 3.14 | 1.22 | 3.51 | 12.74 | 1.91 | 1.34 | 0.66 | 1.23 | 2.91 | 2.00 | 30.65 |
| 2008 | 3.57 | 0.67 | 0.37 | 3.84 | 3.93 | 1.75 | 1.99 | 3.61 | 0.73 | 0.56 | 21.01 |
| 2007 | 0.99 | 0.16 | 2.30 | 1.02 | 3.87 | 2.65 | 0.76 | 4.50 | 1.33 | 3.18 | 20.75 |
| 2006 | 2.46 | 2.88 | 0.41 | 0.74 | 0.90 | 1.35 | 2.43 | 0.59 | 8.46 | 0.83 | 21.05 |
| 2005 | 0.06 | 0.65 | 0.77 | 5.75 | 2.75 | 0.81 | 0.48 | 2.14 | 4.24 | 4.59 | 22.25 |
| 2004 | 2.20 | 2.35 | 0.29 | 5.04 | 3.86 | 0.63 | 0.34 | 1.98 | 0.81 | 3.02 | 20.53 |
| 2003 | 0.91 | 0,01 | 0.28 | 2.51 | 0.94 | 1.66 | 0.90 | 1.45 | 1.03 | 2.63 | 12.32 |
| 2002 | 0.35 | 5.87 | 2.86 | 3.51 | 6.48 | 1.44 | 4.45 | 6.74 | 5.58 | 2.81 | 40.11 |
| 2001 | 1.57 | 1.52 | 3.15 | 0.53 | 4.11 | 1.04 | 0.98 | 1.54 | 1.84 | 1.82 | 18.11 |
| 2000 | 0.50 | 0.03 | 1.35 | 7.21 | 3.50 | 2.99 | 1.67 | 3.79 | 4.24 | 5.19 | 30.45 |
| Average | 1.94 | 2.79 | 3.93 | 3.73 | 3.42 | 2.14 | 2.13 | 2.36 | 1.75 | 2.67 | 26.85 |
Monthly heat summation for T>50°F
< 2007-2016 average
> 2007-2016 average
| Vintage | January | February | March | April | May | June | July | August | September | October | Total |
|---|---|---|---|---|---|---|---|---|---|---|---|
| 2023 | 0.2 | 31.3 | 120.1 | 242.1 | 444.6 | 706.6 | 910.9 | 921.7 | 660.5 | 445.2 | 4483.3 |
| 2022 | 2.5 | 20.7 | 64.8 | 218.7 | 561.4 | 820.6 | 990.2 | 902.2 | 593.3 | 471.3 | 4645.7 |
| 2021 | 0.5 | 36.5 | 84.5 | 144.5 | 370.4 | 735.4 | 830.3 | 824.7 | 648.7 | 252.1 | 3927.6 |
| 2020 | 3.1 | 35.1 | 66.6 | 257.4 | 523.8 | 617.4 | 811.4 | 846.2 | 589.7 | 210.6 | 3961.3 |
| 2019 | 0.5 | 22.1 | 101.5 | 155.9 | 284.2 | 740.2 | 852.3 | 782.8 | 541.6 | 282.6 | 3763.7 |
| 2018 | 0.0 | 0.0 | 23.8 | 291.2 | 430.2 | 674.8 | 848.5 | 852.5 | 629.5 | 288.7 | 4039.2 |
| 2017 | 0.0 | 0.5 | 145.6 | 211.7 | 459.5 | 757.3 | 835.4 | 890.5 | 474.8 | 332.3 | 4107.6 |
| 2016 | 4.0 | 5.0 | 50.2 | 228.4 | 367.7 | 621.7 | 825.8 | 781.9 | 632.0 | 189.4 | 3706.2 |
| 2015 | 15.1 | 0.0 | 69.3 | 227.2 | 462.8 | 680.6 | 957.1 | 779.6 | 477.9 | 202.7 | 3872.2 |
| 2014 | 0.7 | 0.4 | 110.5 | 229.5 | 368.5 | 622.4 | 672.3 | 676.8 | 524.0 | 306.0 | 3510.9 |
| 2013 | 14.2 | 0.0 | 8.6 | 211.0 | 331.7 | 619.0 | 840.2 | 790.2 | 546.8 | 220.5 | 3582.2 |
| 2012 | 1.3 | 21.8 | 215.6 | 142.0 | 429.3 | 716.4 | 821.2 | 880.4 | 503.3 | 299.3 | 4030.4 |
| 2011 | 0.0 | 5.9 | 68.6 | 362.3 | 542.5 | 606.6 | 719.3 | 860.0 | 694.8 | 277.6 | 4137.3 |
| 2010 | 0.0 | 2.0 | 47.0 | 210.6 | 401.6 | 631.4 | 893.0 | 720.0 | 493.9 | 176.9 | 3576.1 |
| 2009 | 0.0 | 0.0 | 54.7 | 209.3 | 569.0 | 674.8 | 802.6 | 854.3 | 577.3 | 288.5 | 4030.6 |
| 2008 | 8.6 | 4.0 | 69.3 | 123.1 | 396.9 | 621.9 | 754.7 | 754.6 | 463.0 | 269.8 | 3465.7 |
| 2007 | 13.9 | 12.4 | 86.6 | 326.0 | 482.8 | 605.5 | 803.2 | 690.1 | 449.8 | 216.7 | 3687.1 |
| 2006 | 0.0 | 0.0 | 33.8 | 209.9 | 410.0 | 563.9 | 910.3 | 669.8 | 578.0 | 326.0 | 3701.5 |
| 2005 | 2.3 | 0.0 | 92.9 | 126.2 | 475.4 | 676.4 | 794.3 | 682.7 | 499.1 | 164.9 | 3514.0 |
| 2004 | 0.4 | 2.0 | 44.6 | 146.9 | 325.8 | 628.4 | 736.0 | 757.6 | 556.0 | 260.3 | 3457.8 |
| 2003 | 1.1 | 0.0 | 62.6 | 164.2 | 502.4 | 824.4 | 854.3 | 961.0 | 470.7 | 148.9 | 3989.3 |
| 2002 | 0.0 | 0.7 | 100.1 | 163.4 | 367.0 | 683.5 | 682.4 | 658.8 | 431.8 | 193.1 | 3280.7 |
| 2001 | 0.0 | 13.0 | 80.8 | 101.5 | 441.4 | 579.1 | 742.7 | 814.7 | 358.9 | 344.9 | 3476.9 |
| 2000 | 2.7 | 0.2 | 73.6 | 160.2 | 470.9 | 654.1 | 656.8 | 755.8 | 544.1 | 216.4 | 3534.8 |
| Average | 5.8 | 5.1 | 78.0 | 226.9 | 435.3 | 640.0 | 808.9 | 778.8 | 536.3 | 244.7 | 3759.8 |
Days of rain per month
Distribution of Rainfall and Harvest Starting Dates